One image is worth a thousand words, it is what people tend to say often. In action movies, we often see scenes where some of the actors is detected moving around in the city by doing facial recognition using video surveillance from public cameras.
Well, most of us know that stuff is not just movie scenes, and that by using the right image processing techniques you can recognize whatever objects you want in an image.
In this post we are going to show you, how can you do a barcode detection in an image using OpenCV. By using some simple techniques so you can understand it in a short time, and then you can try it yourselves.
Barcode detection code
In the next lines of code, we are going to explain you, how can you do barcode detection in a image. We are going to use the OpenCV library that contains different tools and algorithms that can help you do image processing.
import cv2
img1 = cv2.imread(‘barcode_01.jpg’)
img2 = cv2.imread(‘barcode_02.jpg’)
img3 = cv2.imread(‘barcode_03.jpg’)
img4 = cv2.imread(‘barcode_04.jpg’)
img5 = cv2.imread(‘barcode_05.jpg’)
With the code above, we are importing the OpenCV library, and we are reading five pictures that contain barcode.
gray1 = cv2.cvtColor(img1,cv2.COLOR_BGR2GRAY)
gray2 = cv2.cvtColor(img2,cv2.COLOR_BGR2GRAY)
gray3 = cv2.cvtColor(img3,cv2.COLOR_BGR2GRAY)
gray4 = cv2.cvtColor(img4,cv2.COLOR_BGR2GRAY)
gray5 = cv2.cvtColor(img5,cv2.COLOR_BGR2GRAY)
plt.subplot(231)
plt.title(“Image 1”)
plt.imshow(gray1,cmap=‘gray’)
plt.subplot(232)
plt.title(“Image 2”)
plt.imshow(gray2,cmap=‘gray’)
plt.subplot(233)
plt.title(“Image 3”)
plt.imshow(gray3,cmap=‘gray’)
plt.subplot(234)
plt.title(“Image 4”)
plt.imshow(gray4,cmap=‘gray’)
plt.subplot(235)
plt.title(“Image 5”)
plt.imshow(gray5,cmap=‘gray’)
plt.show()
With the code above we are transforming the images from images with three channels of color to images with one channel of color, or simply we are making them black and white images. On the image bellow, we can see how our images look.
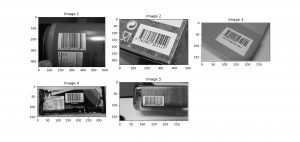
Image 1: Plotted images in black and white
To represent the images in a plot like on Image 1, we have to import the pyplot function from matplotlib library.
gradX = cv2.Sobel(gray1,ddepth=cv2.CV_64F,dx=1,dy=0,ksize=-1)
cv2.imshow(“gradX”,gradX)
gradY = cv2.Sobel(gray1,ddepth=cv2.CV_64F,dx=0,dy=1,ksize=-1)
cv2.imshow(“gradY”,gradY)
With the code above we are calling the Sobel function that will detect the edges of an image in both horizontal and vertical directions. The arguments of the function are:
- src − An object in form of matrix representing the source (input) image.
- ddepth − An integer variable representing the depth of the image (-1)
- dx − An integer variable representing the x-derivative. (0 or 1)
- dy − An integer variable representing the y-derivative. (0 or 1)
The output of this function is and image, with enhanced edges in black and white color.
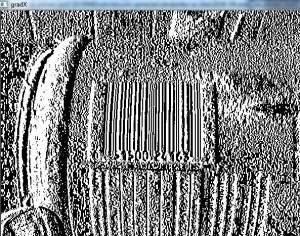
Image 2: Vertical edges detected
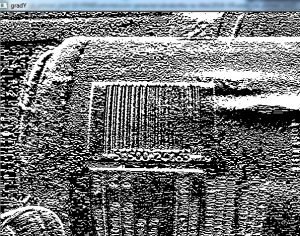
Image 3: Horizontal edges detected
gradient = cv2.subtract(gradX,gradY)
gradient = cv2.convertScaleAbs(gradient)
cv2.imshow(“gradient”,gradient)
blurred = cv2.blur(gradient,(9,9))
cv2.imshow(“blured”,blurred)
With the code above we are subtracting the two gradients, which will result in an image with high horizontal gradients and low vertical gradients, shown below.
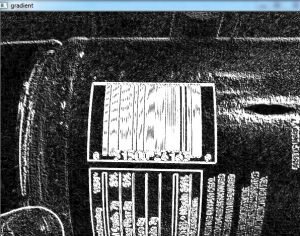
Image 5: Image with high horizontal gradients and low vertical gradients
We also blur the image in order to smooth out high-frequency noise. The result of the blur will be the image below.
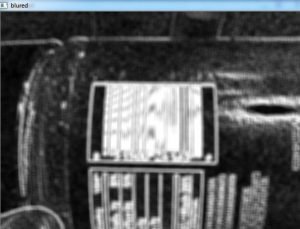
Image 5: Blurred image
ret, thresh = cv2.threshold(blurred,225,255,cv2.THRESH_BINARY)
cv2.imshow(“thresh”,thresh)
With the code above, we will give black color to each pixel which value is smaller than 255, and white to each pixel which value is greater or equal to 255, resulting in the next image.
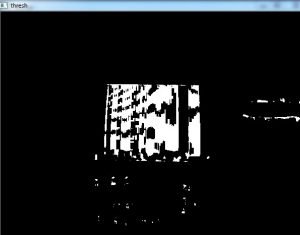
Image 6: Threshold image
As we can see from Image 6, there are a lot of other white bits, that are not part of the barcode. With the following code we are constructing kernel (se) and doing dilation and erosion to the image in order to lose the white bits and to close the black space in the barcode.
se = cv2.getStructuringElement(cv2.MORPH_RECT,(100,7))
closed = cv2.morphologyEx(thresh,cv2.MORPH_CLOSE,se)
closed = cv2.erode(closed,None,iterations=4)
closed = cv2.dilate(closed,None,iterations=4)
cv2.imshow(“ds”,closed)
The execution of the code results in the following image.

Image 7: Morphology, erosion and dilation on image
d,cnts,_ =
cv2.findContours(closed.copy(),cv2.RETR_EXTERNAL,cv2.CHAIN_APPROX_SIMPLE)
i = sorted(cnts,key=cv2.contourArea,reverse=True)[0]
cv2.drawContours(img1,[i],-1,(0,255,0),3)
cv2.imshow(“img1”,img1)
With the code above, we are finding the contours of the image. In findContours function we have three arguments. The first one is the image, the second is the second is contour retrieval mode and the third is the contour approximation method. We can have different values for the second and the third argument.
After we find the contours, we are sorting them, by the area they cover in a reversed order, which means, we will get the biggest contour first, which we are doing by pointing to the first element in the list ( [0] ).
After we have the biggest contour, we are drawing the contour by calling the function drawContours which has arguments like the image that we want to draw on, the contour, the color (in BGR format (it’s RGB format, but it is different in OpenCV)), and the width of the line.
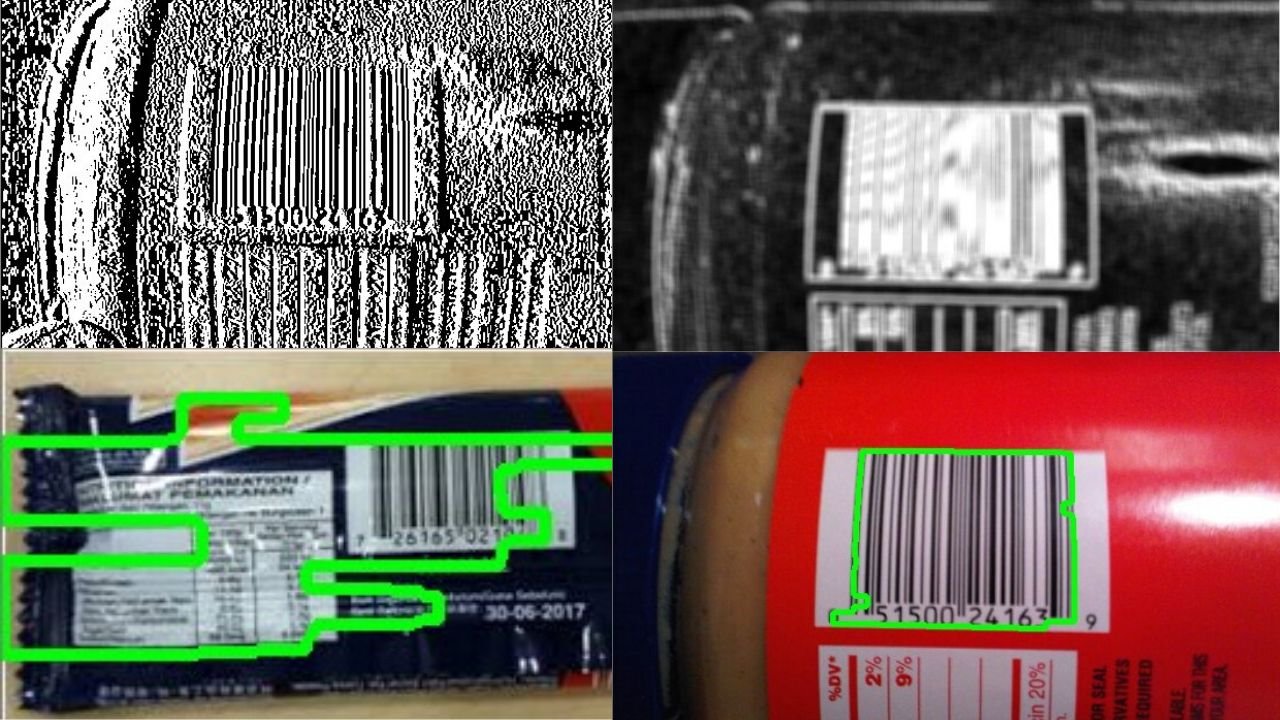
After we have done this, the result is the image below.
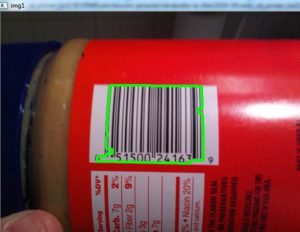
Image 8: Barcode detected
As we can see from Image 8, we have pretty decent results in this case. However, in some of the other pictures, the barcode detection was not quite precise as the one shown on Image 8.
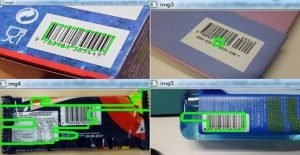
Image 9: Barcodes detection on the other images
As we can see, from Image 9, we have successful barcode detection on images “img2” and “img3“, but not quite successful on images “img3” and “img4“. These results can be changes however by tuning the attributes in the functions that we use (which done pretty often) or using more advanced techniques like deep learning.
Conclusion
This post is an example, of how can you detect objects in images, by fining their edges and then drawing their contours. This is a very simple way of object detection and as you can see from Image 9, it does not always get perfect results. We’ve made it just to show you how it can be done in a simple and understandable way, so you can try to create some more advanced techniques.
We hope that we spark a little interest in you so you will learn more about image processing since this technique is a vital skill of every successful Data Scientist.
We also, suggest you read this article on pyimagesearch.com to learn even more about detecting barcode in images with Python and OpenCV.
Like with every post we do, we encourage you to continue learning, trying and creating.


