Linear regression is a linear approach to modeling the relationship between a scalar response (or dependent variable) and one or more explanatory variables (or independent variables). The case of one explanatory variable is called a simple linear regression. For more than one explanatory variable, the process is called multiple linear regression.
Linear regression has many practical uses. Most applications fall into one of the following two broad categories:
If the goal is prediction, forecasting, or error reduction, linear regression can be used to fit a predictive model to an observed data set of values of the response and explanatory variables.
If the goal is to explain variation in the response variable that can be attributed to variation in the explanatory variables, linear regression analysis can be applied to quantify the strength of the relationship between the response and the explanatory variables, and in particular to determine whether some explanatory variables may have no linear relationship with the response at all, or to identify which subsets of explanatory variables may contain redundant information about the response.
Implementation in Python
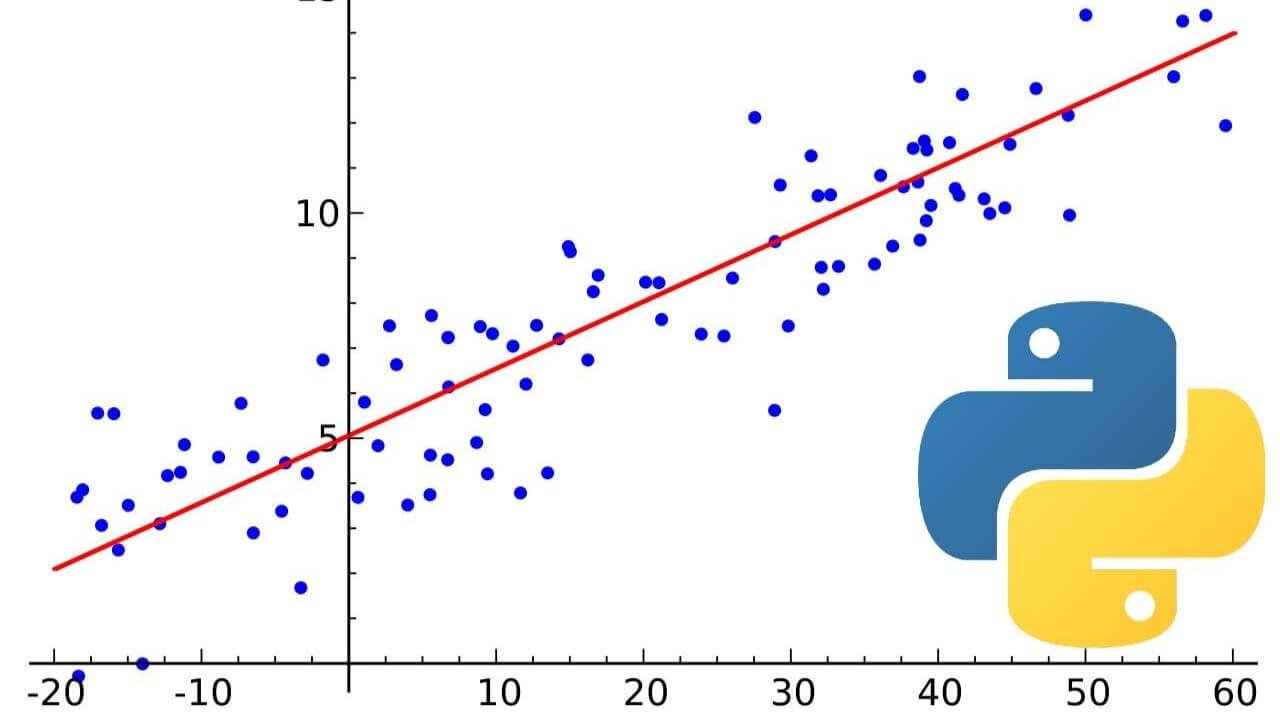
Generally, a 1 model will make predictions by calculating a weighted sum of the input features (independent variables). To the calculated sum a bias is added.
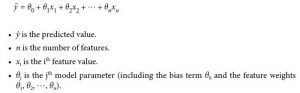
Image 1: Equation of Linear Regression model
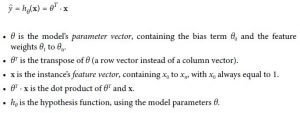
Image 2: Vectorized form of the Equation of Linear Regression model
Before we start to train the model, we need to determine how good the model fits the training data. There are a couple of ways to determine the level of quality, but we are going to show you the most popular one and that is the MSE (Mean Square Error). This means that we need to find the value for θ that will minimize the MSE.
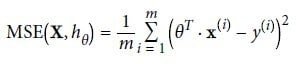
Image 3: Equation of MSE cost function for Linear Regression model
On Image 3 we have the equation for the MSE cost function of a Linear Regression hypothesis hθ on a training set X.
To find the value of θ that minimizes the cost function there is a mathematical equation that can help us determine the value directly. That equation is called a Normal Equation.
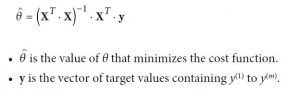
Image 4: Normal Equation in Linear Regression in Python
import numpy as np
import matplotlib.pyplot as plt
With the code above we import the libraries we are going to use. The first is the NumPy library that will help us do multidimensional arrays manipulations and the second is the Matplotlib which will help us plot the result.
X = 2 * np.random.rand(100, 1)
y = 2 + 3 * X + np.random.randn(100, 1)
(The function that we use for the data is y = 2+ 3*x + noise)
With the code above we generate the data.
Next thing is to compute the θ^ using the Normal Equation. We are going to do that by using the inv() function from the NumPy’s Linear Algebra module.
X_b = np.c_[np.ones((100, 1)), X]
theta_best = np.linalg.inv(X_b.T.dot(X_b)).dot(X_b.T).dot(y) print(“THE BEST THETA VALUE IS: “, theta_best)
THE BEST THETA VALUE IS: [[2.15764183] [3.03521853]]
We’ve got our values for θ0=2.157… and θ1=3.035…
After this, we are going to make the predictions, using the code below.
X_new = np.array([[0], [2]])
X_new_b = np.c_[np.ones((2, 1)), X_new]
y_predict = X_new_b.dot(theta_best)
print(“PREDICTION: “, y_predict)
PREDICTION: [[2.15764183] [8.22807889]]
The values that we got with the prediction are the values that show the interval where the data is spreading (looking from y-axis point of view as you can see below in Image 5)
After this, we plot the predictions, with the code below.
plt.plot(X_new, y_predict, “r-“)
plt.plot(X, y, “b.”)
plt.axis([0, 2, 0, 15])
plt.show()
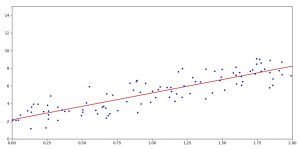
Image 5: Result of the prediction
On Image 5 we have the results of the prediction, the regression line is plotted in red color.
Conclusion
We must mention that we have a post about predicting people’s happiness index using Machine Learning model that we will teach you how to do it.
If you’ve ever touched Machine Learning theory, the Linear Regression is one of the first prediction models that you are going to encounter. It is easy to understand both from the mathematical and programming point of view.
We suggest you look at this model and find some Statistics exercises, find their solution and try to translate it into Python code, it will be very helpful.
Learning this model will help you understand more complex models that are used for better predictions and results in better results with higher accuracy.
Like with every post we do, we encourage you to continue learning, trying, and creating.